A comprehensive technical and fundamental analysis of ETH’s outlook for 2026 — from key support and resistance levels to macro catalysts, upgrade roadmaps, and multi-scenario price targets.
Table of Contents
ToggleIntroduction: Where Does Ethereum Stand Today?
The second-largest cryptocurrency in the world, Ether, will start 2026 in a state of calculated tension. Since the high of about $4,946 reached in August 2025, ETH has since retreated sharply, in the range of 1,900 to 2,100 in the first quarter of 2026, a phenomenon driven by the blistering rise of decentralised finance (DeFi), Layer-2 implementation and institutional capital flows.
To investors, traders, and developers, the central question is no longer whether Ethereum is technologically relevant; whether it is or is not, it has proven itself to be the basis of trillions of dollars of on-chain activity, but whether the utility will be rideable to sustained price growth. Eth is trading at approximately 2067 as of mid-March 2026, slightly above a key psychological support band, which analysts believe serves as a make-or-buy for the next year.
This paper will give a comprehensive Ethereum price forecast in 2026, including the current technical health, major resistance and support levels, the underlying forces that are likely to influence the course of Ethereum, future network upgrades, and price speculations based on the bear-case and euphoric scenarios.
Current Market Snapshot: A Market at a Crossroads
The first half of 2026 has been characterised by wide uncertainty in the crypto markets. The leading role of Bitcoin has continued to put a significant amount of the market on hold, and Ethereum has not been an exception. The token was rapidly falling off its 2025 high and was a combination of selling profit, increased global interest rates and overall risk-off sentiment within the traditional markets.
The bears have not had it all their way, however. The market capitalisation of Ethereum is still at a comfortable level of more than 230 billion dollars, and on-chain metrics paint a picture that is more optimistic than the price chart may indicate. Whaling, especially, has become a topic of interest, with blockchain analytics companies recording that more than 74,000 ETH was withdrawn in exchanges on one day in March 2026, a trend historically indicative of accumulation and not distribution.
There is also institutional conviction. Cryptocurrency company Sharplink, which has followed a similar aggressive strategy in ETH accumulation as that used by MicroStrategy in its case with Bitcoin, has announced that it holds about 864,600 ETH as of March 2026, despite the company registering a loss of about 734 million in the last financial year. Such a belief by the deep-pocketed players is likely to create some sort of structural floor to the market.
Key Data Point
The highest point that Ethereum had ever experienced was in August of 2025 at an all-time high of approximately 4946. By March 2026, ETH will trade around 2,067 or about 58.2 less than that high, historically, a range that corresponds to renewed accumulation in past cycles.
Technical Analysis: Reading the Chart in 2026
Technical analysis is the foundation of near-term price forecasting, and Ethereum’s present chart structure provides a subtle view, not that it is a bullish or bearish price forecast; it is merely resting at an inflexion point, and it can sharpen in either direction.
Key Support Levels
The most important support of ETH is the one around the $1,900-2,000 point. This level has psychological significance as a round number, and, according to technical analysts, buyers have consistently intervened at this level whenever it has faced a downward trend. Beneath the latter, a lower structural level of $1,850 will be supported, and even further down the line by a more drastic one at 1,409 and 886 in case of a more drastic macro-driven sell-off.
Key Resistance Levels
On the positive side, the resistance image is overlaid. The nearest barrier is at $2,124, which is the upper Bollinger Band, and then there is a more serious zone at 2,300 to 2,500. A decisive close above 2,500 with volume affirmation would pave the way to the mark of 3,584 of which various analysts have pegged as the next significant bull leg. In addition to that, there are some progressive goals such as $4,140, $4,814 and a psychologically significant goal of $5,000.
Moving Averages
The shifting average chart is composite. On the daily chart, the SMA 50-day line is at present above the price, which is now at resistance at around $2,189, and the SMA 200-day line has been decreasing since the August 2025 high, following the overall trend. The 50-day moving average on the weekly chart, though, is still high, and it is an indication of longer-term bullish organisation that may reassert itself as the conditions normalise.
RSI and Momentum
The Relative Strength Index (RSI) is trading in neutral as it has been oversold in late 2025. This neither worry-nor-buy reading, albeit indicates that the selling pressure is starting to wear out its welcome. Analysts who have followed the RSI observe that a push above 60 maintained over several sessions would be a technical validation of the revitalised bullish movement. The MACD indicator, on the other hand, continues to exhibit negative bars of the histogram on the daily chart, and this means that the bears continue to hold the advantage in the short term.
2026 Ethereum Price Scenario Overview
Fundamental Drivers: What Will Move ETH in 2026?
Price is eventually an element of supply, demand and story. In the case of Ethereum in 2026, there are various core forces that can influence all three dimensions.
- The Glamsterdam Upgrade (H1 2026)
The greatest short-term ETH trigger is perhaps the Glamsterdam hard fork, which will occur in the first half of 2026 as part of the new biannual release cycle implemented by Ethereum. This upgrade aims at addressing a basic bottleneck: Layer-1 execution capacity. There may be planned enhancements such as increasing the gas limit to and possibly above 100 million (up from the current 60 million), adding block-level access lists to permit parallel transaction processing and increasing blob capacity to be more Layer-2 rollup friendly.
The consequences of these developments are far-reaching. Less network congestion, less gas charges, and an increased throughput can all be translated to a more desirable environment by the developers and users. Provided Glamsterdam works, the project may have a ripple effect in the form of a new on-chain surge and migration back to Ethereum by rival Layer-1s.
- The Hegotá Upgrade (H2 2026)
The Hegotá upgrade (comprising an improvement of the Heze consensus layer and the modifications of the Bogota execution layer) is the second significant milestone planned to be achieved in 2026. The node of this upgrade is the inclusion of Verkle Trees, a novel data format that allows for cutting down the hardware specifications of operating an Ethereum node significantly. Fewer obstacles to node operation are a direct benefit to the concept of decentralisation, which is a fundamental value proposition that makes Ethereum different to centralised competitors and smaller chains.
Hegotá also goes on to promote the enshrined Proposer-Builder Separation (ePBS) of Ethereum, which enhances censorship-resistance and supports the credibility of the network as unbiased, permissionless infrastructure.
- DeFi, Staking, and the EIP-4844 Effect.
Ethernet is still the leading decentralised finance platform, and it has an overwhelming part of the total value locked (TVL) in the whole world. Staking will keep ETH out of the liquid supply – a supply relationship that exerts structural pressure on the price of the token in an upward direction. Statistics indicate that the supply of Ethereum has been relatively constant, with approximately 120.69 million ETH in circulation, indicating that price fluctuations are not being fuelled by inflation of supply but by demand and sentiment.
The consequences of the EIP-4844, which is part of the Dencun upgrade, are still beneficial to the Ethereum ecosystem, as they have lowered the cost of transactions in the Layer-2 networks. The lower cost of L2 transactions attracts more people to the ecosystem, which is a flywheel of activity that eventually accumulates value in the base asset of the network, ETH.
- The Factor of Institutional Adoption and The ETF Factor.
The introduction of spot Ethereum ETFs in the United States has created an additional source of institutional funds. Although Bitcoin ETFs currently enjoy a lion’s share of inflows, the staking yield of ETFs as a potential feature of future ETF products may bring a significant change in the number of people attracted to it. Any form of regulatory movement towards the allowance of staking yields in ETF structures of ETH would constitute a step-change in the demand side, in that traditional investors would be able to access not only the increase in value of the ETF but also its income-generating nature.
Upgrade Watch
There are two significant Ethereum hard forks planned in 2026, Glamsterdam (H1), which is L1 scaling, and Hegotá (H2), which is decentralisation and Verkle Trees. Historically, significant protocol upgrades have been used as a price catalyst for ETH.
What Are Analysts Predicting for ETH in 2026?
Analyst community widely assumes a positive future for Ethereum in 2026, but the amount of returns may differ significantly regarding macro assumptions and risk aversion.
According to conservative estimates by various analytical organizations, risks range between the $3,500 to $4,500 range of full-year 2026, depending on the existing DeFi expansion and the adoption of the Glamsterdam upgrade. Lite Finance shows the point of $3,584 as the critical breakout level above which a technical break to $4,140-6,467 would be possible.
Much more optimistic estimates, especially of analysts who project ETH tracking BTC post-halving movement with a lag, predict that the minimum is between 4,572 and 4,957 as a base case, with a top case of 5,525 to 6,190 if ETH acts decisively and moves and stays above the 4,100-resistance zone. The Changelly projections have projected a potential high of approximately $4,293 at the end of the year 2026 and the average price of trade at approximately 3,665.
The algorithmic model of CoinCodex gives an even more moderate forecast of the near future and estimates ETH to hit about 2,686 in September 2026 and 3,374 in early 2027. The trend is more indicative of slow recovery than a rocket ship.
On the bearish front, analysts observe that unless Ethereum regains the $2,500 mark in the next few months in a convincing manner, it is likely to go through a long period of consolidation or a further drop. The major negative risks are that a Bitcoin correction will drag the rest of the market down, negative news on regulation in key jurisdictions, or that the network upgrades scheduled will fail to show up as per the schedule, potentially disappointing sentiment.
The Bull Case vs. The Bear Case
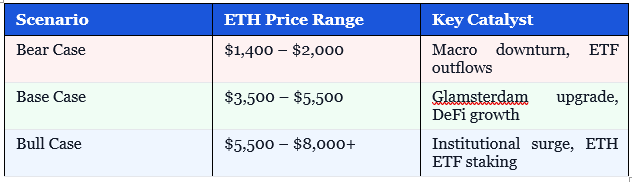
The Bull Case: Path to $6,000+
In the bull scenario, several conditions align to propel ETH toward and potentially beyond its 2025 all-time high by the end of 2026. A successful Glamsterdam upgrade reignites developer enthusiasm and lowers fees, driving a fresh wave of DeFi and tokenisation activity. Institutional ETF inflows accelerate. Whale accumulation — already visible in the on-chain data — translates into a supply squeeze that forces late-arriving buyers to pay higher prices. In this scenario, breaking above $3,584 with conviction could trigger a cascade of liquidations in short positions and propel ETH toward $5,000–$6,000 or beyond.
- Glamsterdam upgrade delivers measurable L1 throughput improvement
- Institutional ETF inflows broaden, especially if staking is permitted
- DeFi TVL and L2 transaction volumes hit new all-time highs
- Bitcoin sustains above $80,000–$100,000, lifting the broader market
- Regulatory clarity in the US and EU reduces institutional risk premium
The Bear Case: Risk of a Test Below $1,500
In the bear scenario, macro headwinds dominate. Rising real interest rates reduce appetite for risk assets globally, and crypto’s correlation with equities — which has tightened in recent years — pulls ETH lower alongside technology stocks. A significant Bitcoin correction below $50,000 would likely drag Ethereum into distressed territory. Technical failure to hold $1,900 support would expose the $1,409 level, and in an extreme scenario, $886 cannot be ruled out.
- US Federal Reserve maintains restrictive monetary policy through 2026
- Glamsterdam delayed or underwhelms on delivery
- Competing L1 chains (Solana, Sui, Aptos) capture meaningful DeFi market share
- ETF outflows intensify, reversing the institutional narrative
- Geopolitical shock triggers broad risk-asset liquidation
The Competition Factor: Can Ethereum Maintain Its Moat?
The competitive environment must not be left out in any price analysis of Ethereum. Solana has been a plausible alternative to high-throughput applications and provides superior transaction speeds and fewer fees by default and at Layer 1, which Ethereum has traditionally approximated with Layer-2 solutions. Developer mindshare is also being contested by other chains such as Sui, Aptos, and Base (Coinbase Ethereum L2).
The competitive moat at Ethereum is still mighty, however. The network effects, which consist of the mere number of developers, capital, protocols, and infrastructure that have been built over a decade, are not easily replicated. The blob transaction of EIP-4844 has significantly lowered expenses throughout the Ethereum Layer-2 environment, and L2 prices have been minimised to the point where they close the divide with rival networks. In contrast to Solana, Ethereum has shown outstanding uptimes and security because of its consensus mechanism.
Upgrades, especially the Verkle Trees in Hegotá, are not expected to reduce the cost of operating a full node, a shift that can further entrench decentralisation and place Ethereum in a better position in any future regulatory landscape that might take into serious consideration more centralised blockchain designs.
Monthly Price Outlook: Q2–Q4 2026
Using a monthly cadence, the following trend is expected to be in line with the base case scenario, provided that macro conditions are broadly non-aggressive and that the planned upgrades can be done on time.
April -June 2026 (Glamsterdam Window): This is what most watchers are circling on their calendars. In case of successful deployment of the upgrade, ETH may break out of more than 2,500. The level of a monthly close would be a good technical sign. Mid-year analyst targets are between $2,686 and 3200.
July-September 2026 (Post-Upgrade Reassessment) The market will probably be in a consolidation period due to the first Glamsterdam reaction, and the investors will evaluate the real-life effect on the network activity and fees. This could be a season of profit-taking, and ETH would be trading between 2,800 and 3,500.
October -December 2026 (Year-End Rally Phase): Cryptocurrency markets have traditionally performed well in the fourth quarter of Q4. With institutional demand presumably accumulating and the Hegotá upgrade on schedule, a run to $4,000-4500 at year’s end is possible. More aggressive projections have December ending as high as $4,293 and the highest point in a bull forecast is about to be about $6,000+.
Key Risks to Monitor
Any fair price forecasting should take into consideration the factors that may nullify the bullish thesis. Risk factors that should be given special consideration in the next five years (2026) include:
- Macroeconomic Deterioration: Ethereum is vulnerable to the risk appetite in the world. A global economic recession or a 20+ equity market decline would squash ETFs and other risky securities.
- Regulatory Risk: Although the overall crypto regulatory atmosphere in the US improved, the situation in Europe and Asia is still volatile. Negative categorisation of ETH as a security by any of the major regulators will be a major and significant trigger.
- Technical Upgrade delays: The history of Ethereum upgrades has been characterised by several delays in the past (most prominently, the long run of the Merge). Any Glamsterdam schedule slip would displease the market and provide an opportunity to the rival storytelling on other chains.
- Layer-2 Cannibalisation: There is a minor risk that Layer-2 scaling solutions that are helpful in the ecosystem could decrease the direct demand for ETH gas in case the fee income on L1 transactions decreases significantly.
- Smart Contract Exploits: The high-profile attacks of large-scale Ethereum-based DeFi protocols have the potential to cause sudden shifts in sentiment and temporary price drops.
Conclusion: A Year of Defining Moves
The price narrative of Ethereum in 2026 is eventually of two rival forces: short-term technical force and long-term structural conviction. In the short-term, ETH is struggling with the implications of regaining resistance levels that have shifted into support, to supply areas, in an environment where the macroeconomic uncertainty remains cautious of risk in all financial markets.
But, at the same time, the main Ethereum case has perhaps never been stronger. Two of the biggest network upgrades on the 2026 program are direct responses to its most frequent weaknesses: throughput, cost, and centralisation risk. The institutional capital is getting into the asset class via regulated ETF vehicles. The supply dynamics on chain, as the supply of ETH is decreasing because of staking and the whale wallets are increasing in size, are an indication of a market that is about to enter the higher price range instead of the lower one.
Critical technical levels to look at are obvious: on the one hand, it is necessary to overcome critical levels of $ 2,124 and then $ 2,500 and, finally, $ 3,584 – the level of which, once cleared, will signal a new wave of bullishness and clear way to analyst targets in the 4,000-6,500 area. Under the base case, the ETH is estimated to be trading at the end of the year 2026 at a range of between 3,500 and 5,500. At this sustained bull, dependent upon successful upgrades and institutional inflows, another encounter with the $6,000 plus range is not improbable.
Like any cryptocurrency investment, there is a lot of uncertainty in this analysis. Markets are uncertain, and even a price forecast, however well formulated, is not deterministic but probabilistic. It is safe to say that 2026 will be a turnaround year for Ethereum and one year where the technical development of the network shall be put to the test in the face of the adoption indicators. Monitoring these resistance levels together with the key levels that have been highlighted in this paper, traders and investors who observe these developments unfolding ought to be ready to adjust and change as the data develops.